By Francisco Mastromarino, Founder, Quick.bot · July 13, 2026
Where Do Users Drop Off in Your Chatbot Flow, and How Do You Find It?
Key takeaways
- To find where users drop off, read per-block drop-off — the abandonment rate at each individual step — not a single global completion number that averages the leak away.
- Map the flow as a funnel, read entries and drop-off at every block, confirm with transcripts, then change one thing and re-measure.
- Quick.Bot marks drop-off per block directly on the flow graph, so the abandoning step is visible without exporting data; Typebot shows a per-input drop-off rate that is revealed on its Pro plan.
- In a typical funnel a single data-capture step can leak 47% while every other step loses 5–30%; a global 30% completion rate would hide that entirely.
To find where users drop off in a chatbot flow you need per-block drop-off, not a global completion rate. Map the flow, read the drop-off at every block, and the step with the sharpest fall is your leak. Once you have isolated the block, fix one thing, then re-measure.
Global completion vs per-block drop-off
How four common views compare for actually locating chatbot drop-off.
| Approach | What it tells you | Good for |
|---|---|---|
| Global completion rate | How many finished the whole flow | A health check, not a diagnosis |
| Per-block drop-off | The exact step people abandon | Finding and fixing the leak ✅ |
| Session transcripts | Why a specific person left | Qualitative spot checks ⚠️ |
| Total sessions | Traffic volume only | Almost nothing about abandonment ❌ |
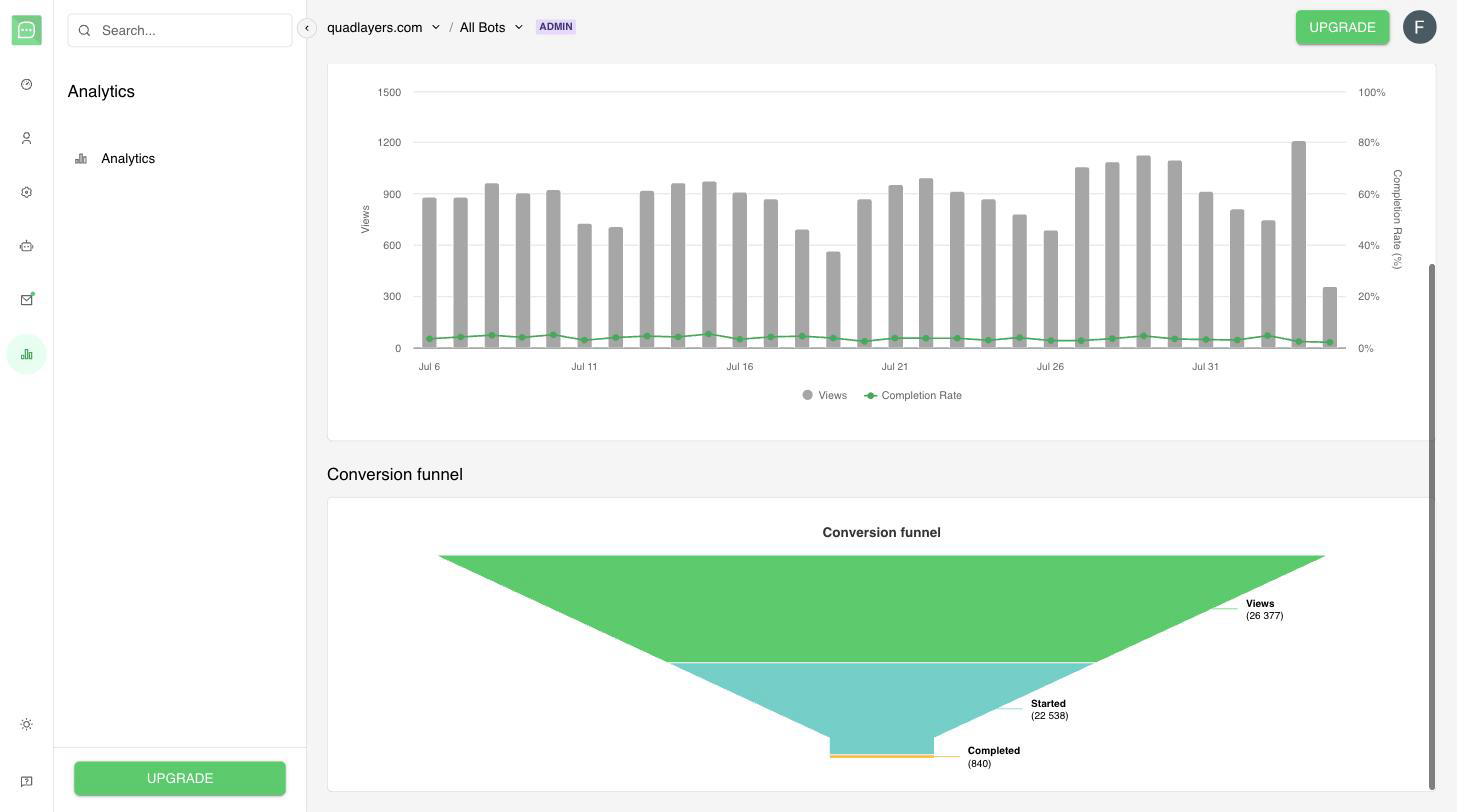
Quick.Bot’s conversion funnel shows where users drop off, from views to completion.
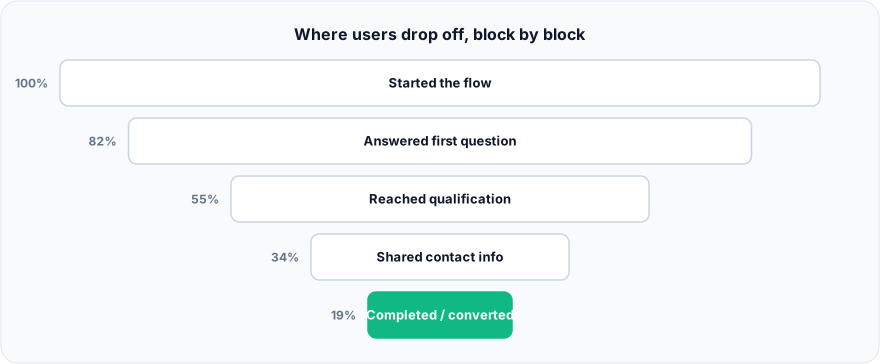
Figure: Where users drop off, block by block.
What is chatbot drop-off?
Chatbot drop-off is the point where a user stops responding and abandons the conversation before reaching the flow’s goal. Every flow has drop-off; the useful question is where. Drop-off concentrated at one block points to a specific friction — a confusing prompt, an unwanted data request, a broken condition — that you can fix. Drop-off spread evenly usually points to length or relevance, a structural problem instead of a single bad step.
How do I find the exact block where users abandon?
Isolate the block by reading drop-off at every step, not just the final completion number. The funnel below shows the pattern: entries only decrease, and the size of each decrease is your signal.
1. Map the flow as a linear funnel
List your blocks in order: entry, greeting, qualifying question, data capture, offer, checkout. Each block is a funnel stage. The count entering each stage should only decrease; the size of each decrease is your signal.
2. Read entries and drop-off at each block
For every block, record how many conversations reached it and how many continued. Worked example:
| Block | Reached | Continued | Drop-off |
|---|---|---|---|
| Greeting | 1,000 | 950 | 5% |
| Qualifying question | 950 | 900 | 5% |
| “Enter your email” | 900 | 480 | 47% |
| Offer | 480 | 430 | 10% |
| Checkout | 430 | 300 | 30% |
The email step is the leak: nearly half abandon there while every other step loses 5–30%. A global completion rate of 30% would have hidden this entirely.
Reading a funnel like this is only fast if your tool shows per-block drop-off where you build the flow. In Quick.Bot the drop-off count sits on each block in the graph, so step 2 is a glance rather than a spreadsheet export.
3. Confirm with transcripts
Open a handful of abandoned conversations at the suspect block. Transcripts tell you why — people balk at giving an email before seeing value, or the prompt was ambiguous. Quantitative drop-off finds the block; qualitative transcripts explain it.
4. Change one thing, then re-measure
Move the email request after the offer, or make it optional, and compare the same funnel a week later. Changing one block at a time keeps cause and effect clean.
Why does global completion rate hide the leak?
A single completion percentage averages every step together, so it cannot tell you which step is broken. Two flows can both complete at 30% — one leaking evenly across ten blocks, the other losing everyone at one broken condition. The fix is completely different, but the headline number is identical. Per-block drop-off is what separates “the flow is too long” from “this one step is broken.”
Does Typebot show per-block drop-off?
Yes, on its Pro plan. Typebot is an open-source conversational form and chatbot builder, and its analytics include a per-input drop-off rate. According to Typebot’s documentation, “The drop-off rate displayed next to each input block is the percentage of users who reached the block but never submitted an answer to it. It is only revealed on the Pro plan.” That plan is $89/mo as of August 2026. Typebot also supports CSV export for deeper analysis. If your flow ends at the bot with no human handoff, that may be all you need; the gap appears when abandonment happens after an agent takes over, which a builder-only view does not track. See Typebot analytics: what’s missing for the full picture.
When a spreadsheet export is the better choice
A CSV export wins when drop-off is one input in a larger revenue model. If you want to blend chatbot drop-off with data from other systems — ad spend, CRM stages, revenue — exporting raw results and analyzing in your own BI tool is the right call, and any builder with CSV export supports that. In-graph drop-off is faster for day-to-day flow fixes; a warehouse export is better when you need to quantify the dollar impact. Many teams use both: the graph to find the leak, the export to price it.
Frequently asked questions
How do I find where users drop off in my chatbot?
Read drop-off at each block instead of the overall completion rate. Map the flow as a funnel, record how many conversations continue past every step, and the block with the sharpest fall is where users abandon. Then open a few transcripts at that block to learn why.
What is a normal chatbot drop-off rate?
It varies by flow length and what you ask for — sensitive data requests like email or phone typically drop more users. The reliable approach is to compare each block against your own flow’s other blocks; the outlier step is the problem regardless of any external benchmark.
Why do users abandon at a specific step?
Usually the step asks for something before showing value, such as an email up front, uses an unclear prompt, or hits a broken condition that dead-ends the conversation. Transcripts at the suspect block reveal which. Fix one cause, then re-measure that block.
Can I see chatbot drop-off without exporting data?
It depends on the platform. Quick.Bot shows drop-off per block directly on the flow graph, so you do not need to export. Typebot exposes a per-input drop-off rate on its Pro plan and lets you export results to CSV for deeper analysis.
Does drop-off analysis work after a human agent joins?
Only if your analytics span the inbox as well as the bot. Abandonment after a handoff — a prospect who goes quiet while waiting for an agent — is invisible to builder-only analytics. In Quick.Bot the bot and the inbox are one product, so the whole conversation — bot turns and agent replies — stays in a single record you can open or export, instead of being split across two tools you have to reconcile.
How is drop-off different from bounce rate?
Bounce is a web term for leaving a page immediately. Chatbot drop-off is abandoning a conversation partway through a flow, which is more granular — you can see the exact block, not just that someone left.
Conclusion
You find chatbot drop-off by reading it per block, confirming with transcripts, changing one step, and re-measuring — never by staring at a single completion number that averages the leak away. For where per-block data fits in the wider metric set, see the WhatsApp chatbot analytics complete guide.
Quick.Bot marks drop-off per block right on the flow graph, so the leaking step is obvious the moment you open the editor. See drop-off per block →