By Francisco Mastromarino, Founder, Quick.bot · July 16, 2026
WhatsApp Chatbot Analytics: The Complete Guide
Key takeaways
- WhatsApp chatbot analytics measures how people move through your bot: where they enter, which step they abandon, how often they reach a human, and how many complete the goal.
- The metrics that actually predict revenue are completion rate, per-block drop-off, time-to-first-response, handoff rate, and resolution rate; vanity counts like total messages sent tell you almost nothing.
- Per-block drop-off is the single most actionable number, because it turns “users are leaving” into “users leave at this exact question,” which is usually a small, fixable problem.
- Time-to-first-response is a revenue metric, not a support metric: Harvard Business Review found responding within an hour made firms nearly 7x more likely to qualify a lead, and over 60x more likely than waiting a day.
- Basic tools such as Typebot report high-level results and submissions, while Quick.Bot marks drop-off per block on the same graph you built the flow in — across a channel with more than 3 billion monthly users.
This guide covers the full topic: the metrics worth tracking, how to read a chatbot funnel, how to locate the exact block where users abandon, and what basic analytics leave out.
The metrics that matter, at a glance
The table below separates the outcome metrics from the vanity ones. Each row reads on its own.
| Metric | What it tells you | Watch for |
|---|---|---|
| Completion rate | Share of users who finish the goal flow | The headline health number |
| Per-block drop-off | Which exact step loses users | The single most actionable metric |
| Time-to-first-response | How fast a human replies after handoff | Directly tied to conversion and CSAT |
| Handoff rate | Share of conversations escalated to a person | Too high = weak automation; too low = frustrated users |
| Resolution rate | Share of conversations actually resolved | The outcome that maps to revenue and retention |
| Total messages sent | Volume only | Vanity — ignore in isolation |
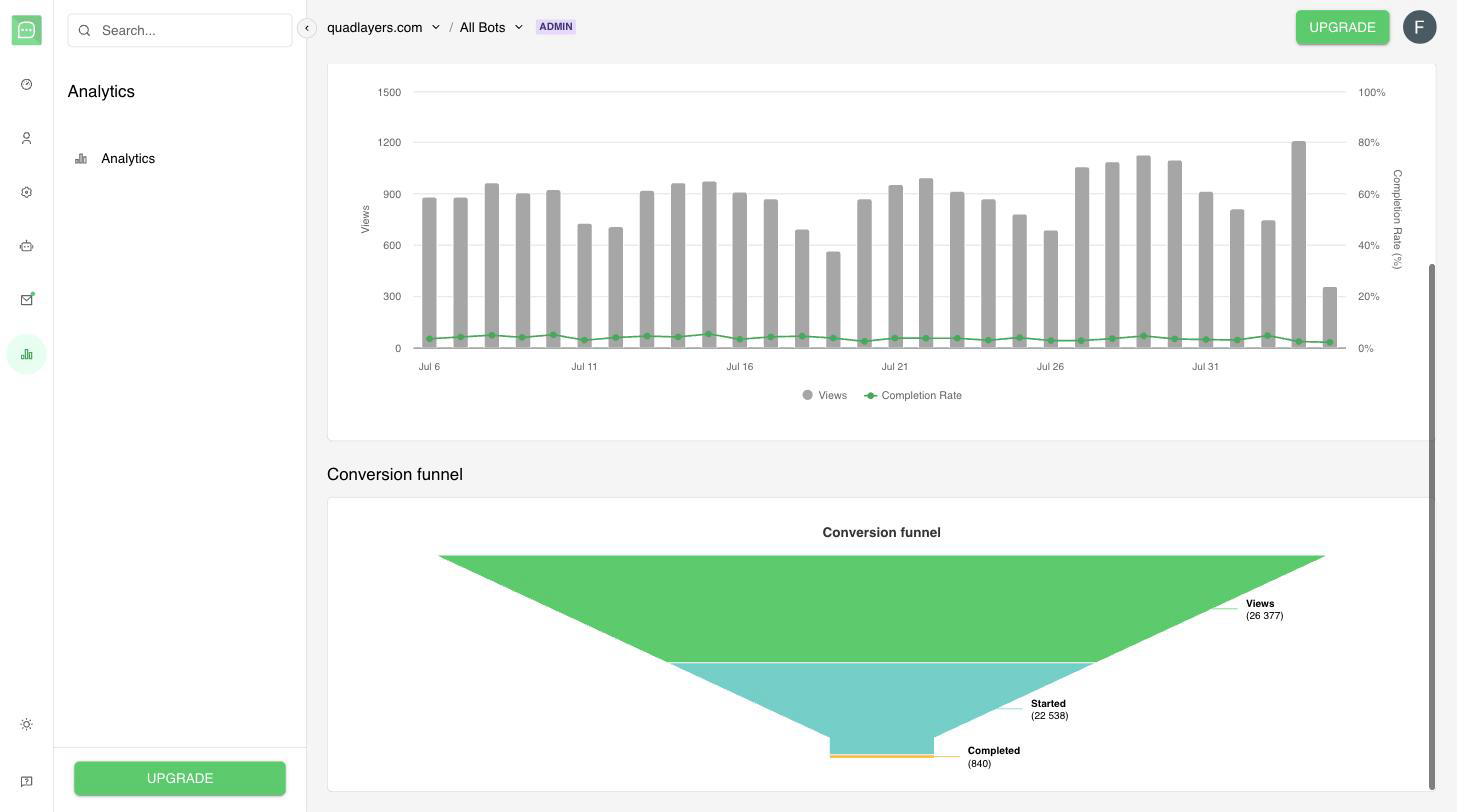
Quick.Bot’s conversion funnel shows where users drop off, from views to completion.
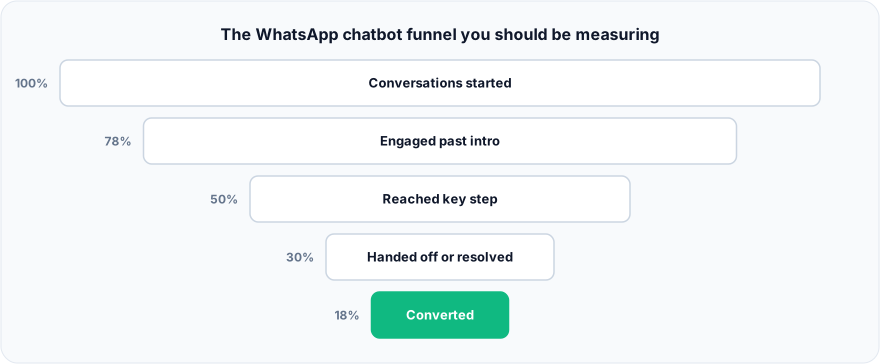
Figure: The WhatsApp chatbot funnel you should be measuring.
What is WhatsApp chatbot analytics?
Chatbot analytics is the funnel view of a conversation. Instead of a web page’s pageviews and clicks, you measure entries into the flow, progression from step to step, abandonment at each step, escalation to a human, and completion of the goal (a booking, a qualified lead, a payment, a resolved ticket). On WhatsApp this matters more than on a web widget because every conversation is a direct, one-to-one thread with a real customer — a drop-off is a person who raised their hand and then left.
The scale is the reason to instrument it well. As Meta’s developer documentation puts it, “The WhatsApp Business Platform enables businesses to communicate with customers at scale,” and WhatsApp now serves more than 3 billion monthly users — so a two-point improvement in completion rate is a large number of real conversations.
The diagram below maps a conversation as a funnel and shows where each core metric is measured.
What is Quick.Bot?
Quick.Bot is a no-code, WhatsApp-first chatbot builder with a visual drag-and-drop flow builder, a native shared team inbox, and built-in conversation analytics. Its analytics show who is chatting, what they ask, and where they drop off in the flow, so you can optimize and convert. Because the builder, the inbox and the analytics are one product, drop-off is marked against the same blocks you designed the flow in.
Which chatbot metrics actually predict revenue?
Five metrics map to outcomes; treat the rest as context.
- Completion rate is the share of people who start the flow and reach the goal. It is your headline number: if it moves, revenue usually moves with it.
- Per-block drop-off shows which specific step sheds users. This is the most actionable metric you have, because it points at a fixable cause — a confusing question, a bad button, a request for information too early.
- Time-to-first-response measures how quickly a human replies once a conversation is handed off. On WhatsApp, minutes matter; a slow first response is a lost sale.
- Handoff rate is the share of conversations escalated to a person. Read it in both directions: very high means the bot is not resolving enough on its own; near zero can mean users who want a human are stuck.
- Resolution rate is the share of conversations that actually end resolved — the outcome that ties most directly to revenue and retention.
Metrics to keep in context rather than chase: total messages sent, raw session counts, and “engagement” numbers that go up simply because traffic went up. They describe activity, not results. For the full list with worked examples of each, see the 9 WhatsApp chatbot metrics that actually predict revenue.
Why is time-to-first-response a revenue metric?
Time-to-first-response predicts revenue because prospects go cold fast, and the effect size is large. In an audit of 2,241 U.S. firms, Harvard Business Review researchers reported:
Firms that tried to contact potential customers within an hour of receiving a query were nearly seven times as likely to qualify the lead (which we defined as having a meaningful conversation with a key decision maker) as those that tried to contact the customer even an hour later — and more than 60 times as likely as companies that waited 24 hours or longer.
That study measured hour-scale windows on email and phone leads; on WhatsApp the customer expectation compresses to minutes, so time-to-first-response after a handoff belongs next to completion rate as a headline metric — not buried in a support dashboard. If your analytics stop at the bot boundary and never measure how long a handed-off customer waited, you are blind to one of the strongest predictors of conversion you have.
How do I find where users drop off in my flow?
Read your flow as a funnel and look for the step where the count falls off a cliff. If 1,000 people enter, 900 pass the greeting, 850 answer the first question, and then only 300 pass step four, step four is your leak — not the ending, not the greeting. The drop is where you spend your optimization effort.
The common causes at a leaking block are: asking for sensitive data too early (phone, email, ID), a question with unclear options, too many choices at once, a dead end with no path forward, or a long wait before a reply. Once you can see the exact block, the fix is usually small — reorder a question, cut an option, add a fallback.
This is where per-block analytics earn their keep: instead of guessing which question is scaring people off, you see the number drop on one specific block.
The practical method for isolating that block — reading per-step counts and spotting the cliff — is covered in where users drop off in your chatbot flow and how to find it. In Quick.Bot, drop-off is marked per block directly on the graph, so the leak shows up on the same canvas where you built the flow.
How do I read a chatbot funnel correctly?
Three rules keep funnel reading honest and stop you from acting on noise.
- Segment by entry point. Users who arrive from an ad, a QR code, and an existing customer thread behave differently. A blended funnel hides that a specific source is dropping.
- Compare over a fixed date range. A drop-off number means nothing without a window. “30% abandon at step four this week vs. last week” is a signal; “30% abandon” alone is a snapshot.
- Separate abandonment from handoff. A user leaving the bot because they reached a human is a success; a user leaving because they were confused is a failure. If your analytics lump the two together, your completion rate is misleading.
Getting these right is what turns a chart into a decision. Without date ranges and segmentation, you are looking at totals, not trends.
What do basic chatbot analytics miss?
Basic analytics answer “how many” but not “where” or “why.” Entry-level tools usually give you submissions, total starts, and maybe a completion count — useful, but not enough to fix a flow. The gaps that matter most are:
- Per-block funnel. Totals tell you that people leave; only a per-step funnel tells you where.
- Flexible date ranges. Without arbitrary windows you cannot compare before and after a change, or this month against last.
- Transcript access. Numbers show the leak; reading real transcripts at the leaking block tells you why.
- Handoff and resolution data. Builder-only analytics often stop at the bot boundary and never measure what happens once a human takes over.
For an honest look at those limits in a basic tool and how to cover them, read Typebot analytics: what’s missing and how to get real funnel data. The takeaway is not that basic analytics are useless — they answer “how many” — but that improving conversion needs “where” and “why,” which require a per-block funnel and transcripts.
Quick.Bot narrows those gaps natively: per-block drop-off marked on the graph, full conversation records you can read or export, and a conversation that does not stop at the bot — the agent replies belong to the same record instead of a separate tool.
When basic or external analytics are the better choice
Basic or external analytics are genuinely the better choice in a few cases, and it is fair to say so. If you run a very simple bot — a one-step FAQ or a single lead form — a submission count may be all the signal you need, and anything more is overhead. If your company already standardizes on a warehouse or a BI tool and pipes every event there, you may prefer to export raw events and build funnels in the tool your analysts already use, rather than rely on any product’s built-in views. And if you are validating a brand-new flow with a handful of users, reading transcripts by hand can teach you more than any dashboard. Native, per-block analytics win when you are optimizing a real flow at volume; lightweight or external analytics win for simple bots and centralized data teams.
Frequently asked questions
What is WhatsApp chatbot analytics?
It is the measurement of how users move through a WhatsApp bot: entries, step-by-step progression, per-block drop-off, escalation to a human, and completion of the goal. It is the funnel view of a conversation rather than the pageview view of a website.
What is the most important chatbot metric?
Per-block drop-off is the most actionable single metric because it points at the exact step losing users, which is usually a small, fixable problem. Completion rate is the best headline metric because it moves with revenue, but drop-off tells you what to change to improve it.
How do I find where users abandon my chatbot flow?
Read the flow as a funnel and find the step where the user count falls sharply — that block is your leak. Then read transcripts at that block to learn why, and fix the question, options, or ordering. Quick.Bot marks drop-off per block directly on the flow graph.
What analytics does Typebot provide, and what is missing?
Typebot offers high-level results and submission data, which answers how many people started and finished. What basic analytics commonly miss is a per-block funnel, flexible date ranges, transcript access at the leak, and handoff/resolution data — the pieces you need to know where and why users drop. See Typebot analytics: what’s missing.
What is a good chatbot completion rate?
It depends heavily on flow length and goal — a short FAQ completes far higher than a multi-step qualification flow — so the useful benchmark is your own trend over a fixed date range, not an absolute number. Track completion week over week and after each change rather than chasing an industry figure.
Why does time-to-first-response affect revenue?
Because leads go cold quickly: Harvard Business Review’s audit of 2,241 firms found that contacting a lead within an hour made a firm nearly 7x more likely to qualify it, and over 60x more likely than waiting 24 hours. On WhatsApp, where customers expect near-instant replies, a slow first response after handoff is a lost sale, which is why it belongs alongside completion rate as a headline metric.
Conclusion
Good WhatsApp chatbot analytics is not a wall of numbers — it is a small set of outcome metrics (completion, per-block drop-off, time-to-first-response, handoff, resolution) read as a funnel with proper date ranges and segmentation. The most valuable view is per-block drop-off, because it turns “users are leaving” into “users are leaving at this exact question,” which you can fix. Basic tools answer “how many”; improving conversion needs “where” and “why.”
Quick.Bot ships much of that view out of the box — per-block drop-off on the graph, and full conversation records, agent replies included, in one exportable place. Get the inbox, handoff and analytics in one platform — start free or book a demo →