By Francisco Mastromarino, Founder, Quick.bot · July 9, 2026
What WhatsApp Chatbot Analytics Metrics Actually Predict Revenue?
Key takeaways
- WhatsApp chatbot analytics should track nine revenue-linked metrics — completion rate, drop-off per block, time-to-first-response, handoff rate, resolution rate, qualified-lead rate, average handle time, response-window compliance, and cost per resolved conversation.
- Vanity counts like total messages or sessions started rise with traffic and budget, not performance, so they predict almost nothing about revenue.
- Quick.Bot surfaces completion and per-block drop-off natively across the bot and its shared inbox; builder-only tools like Typebot measure the bot flow but stop at the human handoff where WhatsApp sales usually close.
- WhatsApp has more than 3 billion monthly active users (Meta, May 2025), and its 24-hour customer service window ties response-time metrics directly to messaging cost.
WhatsApp chatbot analytics is the measurement layer over a conversational flow: how many people enter, where they stop, how fast they get a reply, when a human takes over, and whether the conversation ends in a sale or a solved request. Below are the nine metrics that move revenue and the vanity counts to ignore.
The 9 metrics vs the vanity metrics
Nine revenue-linked WhatsApp chatbot analytics metrics, each paired with the vanity count it should replace.
| Metric | What it predicts | Vanity metric to ignore |
|---|---|---|
| Flow completion rate | Whether the bot finishes its job | Total sessions started |
| Drop-off per block | The exact step leaking revenue | Average messages per chat |
| Time-to-first-response | Whether prospects wait or bounce | Total messages sent |
| Handoff rate | Bot coverage and escalation load | Number of flows published |
| Resolution rate | Whether conversations end solved | Unique contacts reached |
| Qualified-lead rate | Pipeline quality, not quantity | Raw lead count |
| Average handle time | Agent efficiency and staffing | Hours the bot was “online” |
| Response-window compliance | Deliverability and re-engagement cost | Broadcast open rate alone |
| Cost per resolved conversation | Unit economics of the channel | Cost per message |
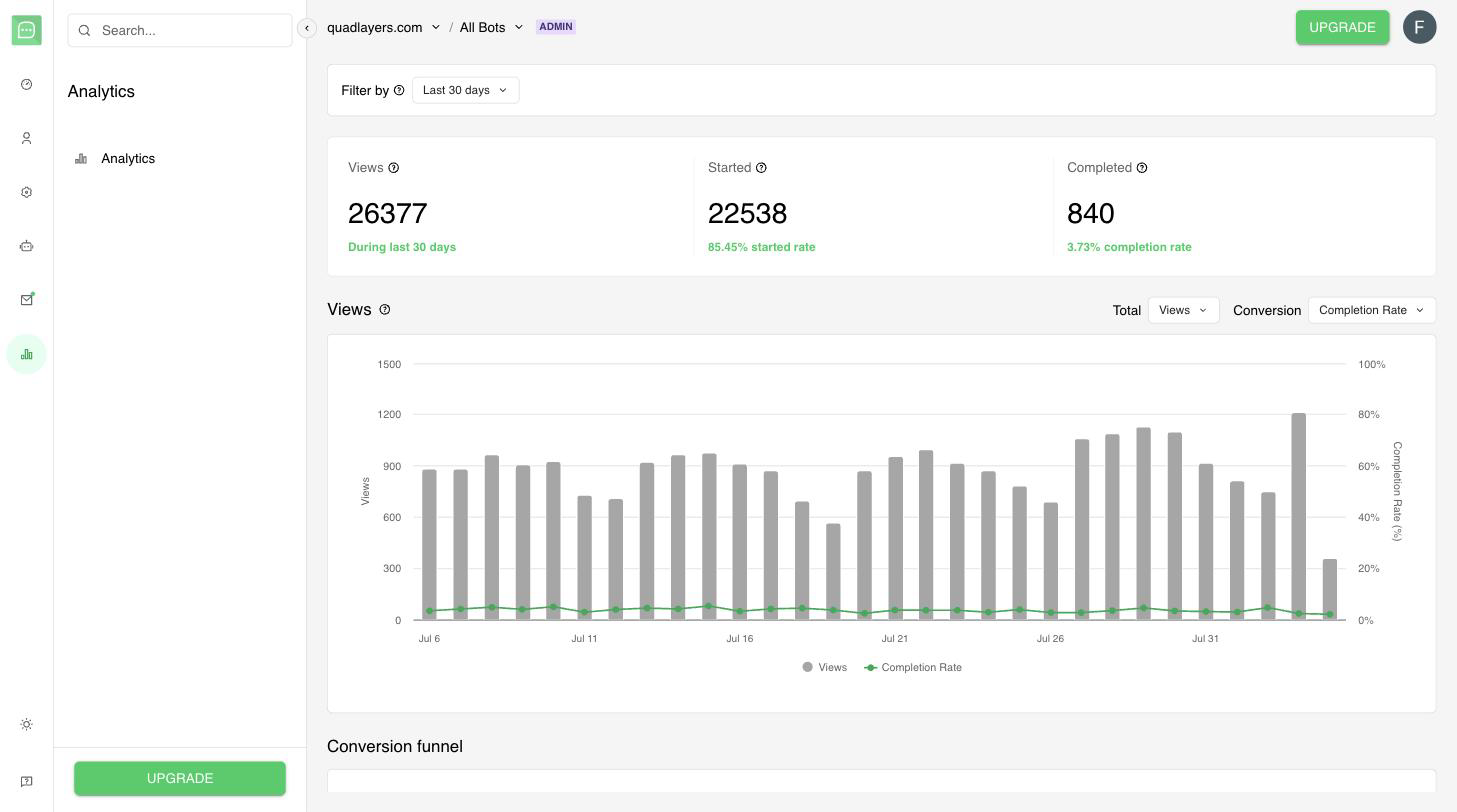
Quick.Bot analytics: views, start rate and completion rate over time.
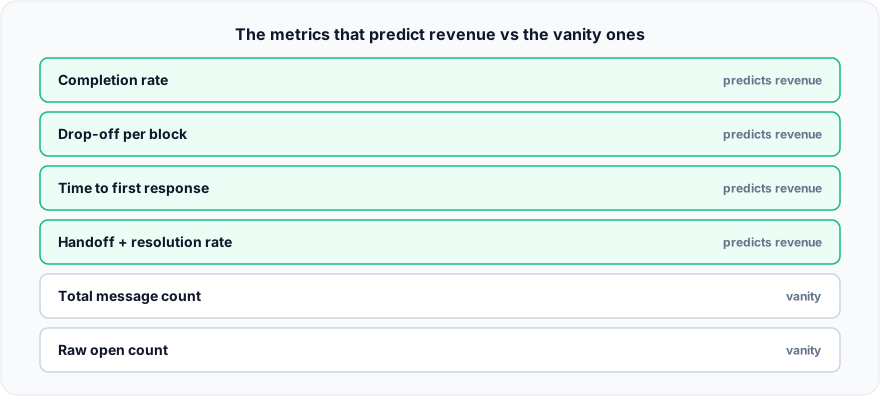
Figure: The metrics that predict revenue vs the vanity ones.
What counts as WhatsApp chatbot analytics?
WhatsApp chatbot analytics measures the full conversation, from the automated flow into the human handoff. Good analytics connect the bot to the agent, because on WhatsApp most revenue is closed after a handoff, not inside the bot. A builder that stops measuring at the bot boundary leaves the revenue-closing stage blind.
The nine metrics fall into a simple hierarchy: outcome metrics you optimize toward, diagnostic metrics that tell you where to act, and cost metrics that keep the channel honest.
1. Flow completion rate
Completion rate is the percentage of started conversations that reach the flow’s goal — a booking, a qualified lead, a paid order. It is the single clearest health signal. Worked example: 1,000 sessions start, 240 reach checkout, so completion is 24%. Lift that to 30% and you add 60 goal conversions on the same traffic, with no extra ad spend.
2. Drop-off per block
Completion tells you that people leave; drop-off per block tells you where. If 47% of users abandon at a single “enter your email” step, that block — not the whole flow — is your revenue leak. Per-block drop-off is what turns analytics into an action.
If your current tool only shows a global completion number, you are guessing at which step to fix. Quick.Bot marks per-block drop-off directly on the flow graph, so the leaking step is visible the moment you open the editor.
3. Time-to-first-response (TTFR)
On WhatsApp, response speed carries a direct cost, not just a UX penalty. According to Meta’s WhatsApp Business Platform documentation, “When a WhatsApp user messages you or calls you, a 24-hour timer called a customer service window starts.” Replies inside that 24-hour window are unrestricted; replies after it require paid template messages. Track agent-side TTFR separately from the bot’s instant reply.
4. Handoff rate
Handoff rate is the share of conversations the bot escalates to a human. Too high means the bot is not covering common intents; too low can mean it traps people who needed a person. Read it together with resolution rate: a healthy funnel automates the routine and escalates the valuable.
5. Resolution rate
Resolution rate is the percentage of conversations that end solved — order placed, question answered, ticket closed — whether by bot or agent. Unlike completion, which is bot-only, resolution spans the whole conversation, which is exactly why a builder that stops at the handoff boundary cannot report it.
6. Qualified-lead rate
Qualified-lead rate is the share of conversations that meet your qualification criteria — budget, intent, region. A bot producing 500 leads at 10% qualified is worth less than one producing 300 at 40%. Tie this metric to the specific flow steps that do the qualifying.
7. Average handle time (AHT)
For conversations that reach an agent, AHT is the average time to resolve. It drives staffing and reveals whether the bot passes clean, context-rich handoffs or dumps cold conversations that agents must restart. Context transfer at the handoff is the biggest lever here.
8. Response-window compliance
Response-window compliance is how often you reply inside the 24-hour customer service window. Replies within it are free and unrestricted, and a fast reply can open a Free Entry Point window that stays open for 72 hours at no charge (Meta). Staying inside the window keeps re-engagement costs down and protects deliverability.
9. Cost per resolved conversation
Cost per resolved conversation is total channel cost — messages, platform, agent time — divided by resolved conversations. It lets you compare WhatsApp honestly against other channels and justify automation with math instead of opinion.
Which metrics should you actually ignore?
Ignore counts that go up when nothing improves: total messages, sessions started with no outcome attached, “contacts reached”, and raw broadcast opens. They rise with traffic and budget, not performance. A useful rule: if a metric cannot tell you which step to change tomorrow, it is a report decoration, not a decision input.
When a builder-only analytics tool is the better choice
A builder-only tool wins when your WhatsApp bot never hands off to a human. If the flow is a self-contained survey, quiz, or simple lead capture, an open-source builder like Typebot is a reasonable fit — it is a conversational form and chatbot builder with built-in completion and drop-off analytics and CSV export, and for a bot that never escalates, completion and per-block drop-off may be all the analytics you need. The gap appears only when revenue is closed by a human after the bot, because that stage sits outside a builder-only view.
Frequently asked questions
What is the most important WhatsApp chatbot metric?
Flow completion rate is the best single indicator, because it measures whether the bot achieves its goal. Pair it with per-block drop-off so you know not just how many people finish, but exactly where the rest leave. Together they turn a health check into a fix list.
What is a good chatbot completion rate?
There is no universal benchmark — it depends on flow length and intent. The practical target is improvement over your own baseline: measure, change one block, and compare against the previous week.
How is drop-off rate different from completion rate?
Completion rate is the percentage of users who reach the goal. Drop-off per block is the percentage who abandon at each individual step. Completion is the outcome; per-block drop-off is the diagnosis that tells you which step to fix first.
Can I measure the human-agent part of a WhatsApp conversation?
Only if your platform spans the bot and the inbox. Resolution rate, average handle time, and agent time-to-first-response require analytics over the human handoff, which builder-only tools generally do not cover. In Quick.Bot the bot and the shared inbox are one product, so both halves of the conversation are in the same place to measure — rather than split across two systems with no shared identifier.
Does Typebot show WhatsApp chatbot analytics?
Typebot provides completion and drop-off analytics with CSV export for the bot flow itself. It is built as a bot and form builder, so it measures the automated conversation rather than post-handoff agent resolution. For the gaps, see Typebot analytics: what’s missing.
How do I find exactly where users abandon my flow?
Use per-block drop-off, not a global number. Map the flow as a funnel, read how many conversations continue past each step, and the block with the sharpest fall is the leak. A step-by-step guide is in where users drop off in your chatbot flow.
Conclusion
Revenue on WhatsApp is predicted by a handful of metrics that connect the bot to the human: completion, per-block drop-off, first-response time, handoff and resolution, lead quality, handle time, window compliance, and cost per resolved conversation. Track those, ignore the vanity counts, and every optimization becomes measurable. For the full framework, see the WhatsApp chatbot analytics complete guide.
Quick.Bot ships completion and per-block drop-off out of the box, and keeps the agent side of every conversation in the same product rather than a separate tool. Try Quick.Bot free →